
Modern businesses rely heavily on web applications, cloud platforms, and servers that must operate continuously. Even a short downtime can impact customer experience, revenue, and operational efficiency. This is why server monitoring tools are essential for IT teams and system administrators.
Server monitoring tools help track server performance, uptime, CPU usage, memory consumption, network traffic, and application health. These tools also generate alerts when issues arise, allowing teams to respond quickly before problems escalate.
In addition to tools, organizations also need proper processes and skilled teams to monitor alerts and resolve technical issues around the clock.
Before investing a large portion of your IT budget in enterprise monitoring software, consider exploring free and open-source server monitoring tools. These tools can be a great starting point for monitoring your IT infrastructure.
Popular Server Monitoring Tools
1. SolarWinds Server & Application Monitor

SolarWinds Server & Application Monitor provides advanced monitoring capabilities including capacity planning, performance baselines, asset inventory, reporting, and user access control.
The platform supports monitoring for more than 200 applications and server technologies, including Linux, Windows, Java, IIS, Exchange, and Active Directory. While it is a paid solution, SolarWinds offers a 30-day free trial and delivers powerful monitoring features suitable for enterprise environments.
2. Nagios Core

Nagios Core is one of the most widely used open-source server monitoring tools. It allows administrators to monitor server performance, applications, and network infrastructure.
The platform is highly customizable and supported by a large community of developers and IT professionals. However, initial setup and configuration can be complex and may require advanced technical knowledge.
3. Monitor.us

Monitor.us is a cloud-based monitoring solution designed to track the health and availability of servers and workstations.
It provides real-time visibility into CPU usage, disk space, bandwidth, and memory performance. Since it is hosted in the cloud, organizations do not need to install or maintain software locally.
4. SolarWinds Server Health Monitor

SolarWinds Server Health Monitor helps IT teams monitor hardware metrics such as temperature, fan speed, CPU health, and power supply status.
The tool allows administrators to detect hardware issues quickly and identify problems affecting server performance.
5. Ganglia

Ganglia is an open-source monitoring platform designed for large-scale distributed systems and high-performance computing clusters.
It supports multiple operating systems and uses efficient data structures to minimize monitoring overhead while providing scalable infrastructure monitoring.
6. CollectD

CollectD is an open-source system statistics collection tool used to gather data such as CPU usage, memory utilization, and network performance.
The collected data can be stored in multiple formats and integrated with visualization tools like Grafana, Graphite, and Cacti.
7. Cacti

Cacti is a graphing and monitoring solution that helps administrators visualize performance data through customizable charts and graphs.
It collects data using external scripts and stores it in a MySQL database, enabling detailed performance analysis over time.
8. Zabbix
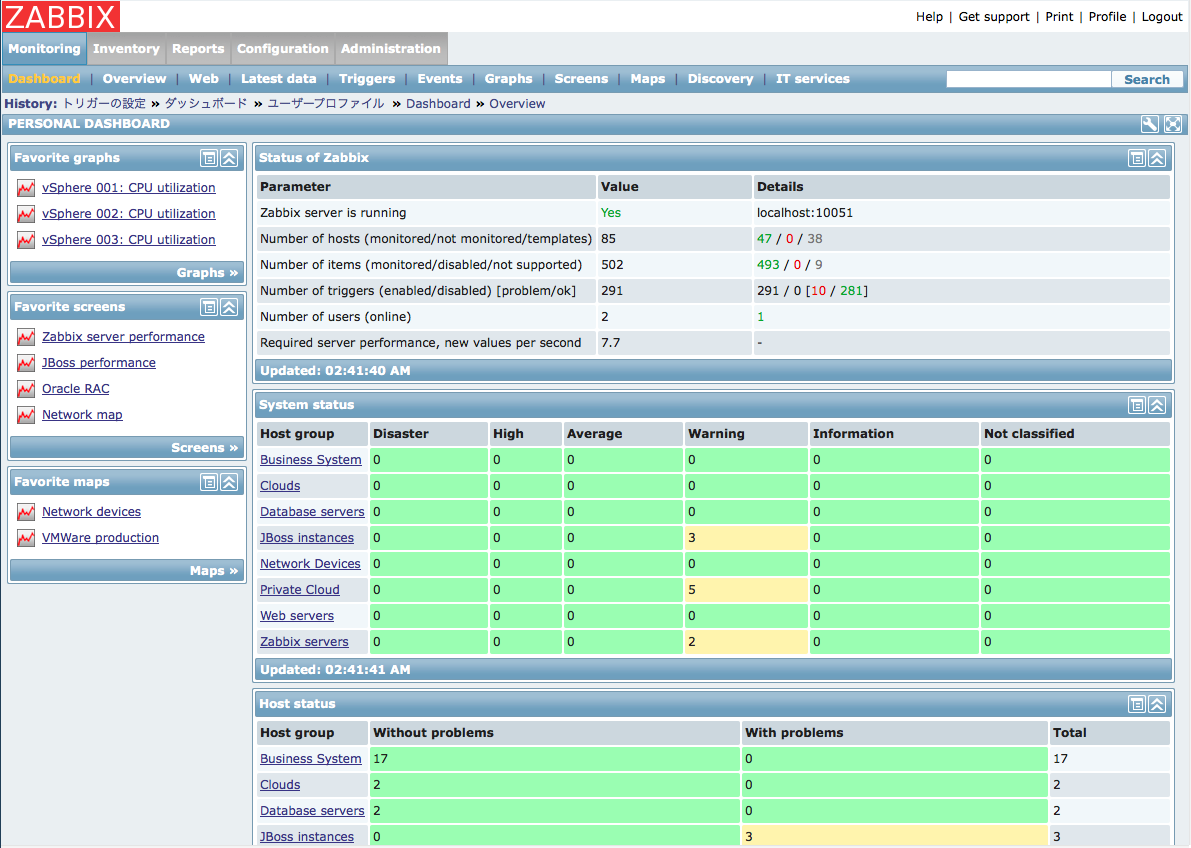
Zabbix is an enterprise-grade monitoring platform used by organizations worldwide to monitor servers, applications, and network devices.
It provides a user-friendly web interface, powerful alerting capabilities, and strong community support. Zabbix also supports performance trending and monitoring from a centralized dashboard.
9. OpenNMS

OpenNMS is a scalable monitoring platform designed for monitoring networks and IT infrastructure.
It supports data collection using protocols such as SNMP, WMI, JMX, HTTP, and JDBC. OpenNMS also integrates with Grafana dashboards for advanced data visualization.
10. Icinga

Icinga is a monitoring tool that evolved from the Nagios project. It offers improved scalability, faster performance, and easier configuration.
The platform can monitor network services, servers, and applications while generating alerts and reports for SLA tracking.
11. Sciencelogic EM-7
With lower “Total Cost of Ownership”, Sciencelogic EM-7 provides uninterrupted support for the complete system by a single vendor. It provides optimized operations (pre-loaded and built as a comprehensive integrated solution) and can be easily deployed. With no costly integration projects, the scalable solution architecture provides a cost-effective solution to start small and grow rapidly. EM7’s single data store is fully integrated, performance-tuned and self-managed with an automated backup strategy that is efficient. Sciencelogic EM-7 delivers superior security architecture through the hardened operating system and built-in dynamic firewall and has no modules and has all its functionality included in the base product offering. Additional enhancements are made to one coherent system and not to multiple systems with different requirements.

Pros:
- Cost: EM7 starts at $25,000 for a single all-in-one box that can manage a few hundred devices, while CA, Hewlett-Packard, and IBM offerings are at least 10 times more expensive
- Quicker installation
- Robust GUI offers device pop-up menus and is easy to navigate.
Cons:
- Doesn’t support Windows WMI;
- Can’t collect network-flow information, as sFlow or Cisco Systems’ Netflow do.
- EM7 neither provides an overall topology map nor can it correlate network and systems outages.
12. GFI Network Server Monitor
GFI Network Server Monitor monitors servers and network for software and hardware failures. It’s quite simple to use, learn and deploy and automatically alerts and corrects network and server issues. It monitors web servers, Exchange, ISA, and SQL.

Pros:
- Easy to setup (Expect to be up and live within an hr)
- Automatically alerts and corrects network and server issues;
- Offers a good library of built-in checks that you can instantly tap into;
- Simple, intuitive configuration interface;
- Mature product
Cons:
- Fluctuating Prices: Cost of the product varies with the number of IP addresses monitored.
- The web interface is limited by current standards.
13. Anturis – Cloud-based Monitoring Service for Servers and Web sites, IT Infrastructure Monitoring
 Built for external monitoring of company web services and internal monitoring of IT infrastructure, such as servers and applications, Anturis is a cloud-based (SaaS) monitoring platform. Backed by experienced IT experts and software engineers from leading global IT companies and startups including Parallels, Kaspersky Lab, Amdocs, Atempo, K7 Cloud, and jNetX, it costs $9.50 monthly and renders free plan for a limited period.

14. CopperEgg – IT Infrastructure Monitoring

Server Monitoring and Website Monitoring for cloud infrastructure by CopperEgg. CopperEgg provides simple, unified, smart, and fast insight into your AWS cloud servers (EC2), websites, web applications, and services to optimize performance and troubleshoot issues in a single pane of glass. The CopperEgg unified dashboard updates every few seconds (not minutes) and reveals details that help uncover previously hidden information, like CPU Steal, and resolve problems before they arise.
CopperEgg caters to Server Monitoring and Website Monitoring for cloud infrastructure with unified dashboards periodically (every few seconds) and discloses reveals information that helps uncover previously hidden information, like CPU Steal, and proactively resolve problems.
15. Instrumental – Free developer accounts for application & server monitoring

The query language allows the user to transform, aggregate and time-shift data in real-time. It renders real-time visualizations, automatic data collection and provides intelligent alerts across your application and servers. Over a million data points are processed every second and can, therefore, handle data in large scale. All signups include a free developer account for up to 500 metrics so you can get fully set up without burning a hole in your pocket. Cost is pretty much pocket-friendly, it’s Free for up to 500 metrics, then $0.10/month per metric.
16. LogicMonitor – Hosted monitoring of networks, servers, applications, storage & cloud

Along with pre-configured out-of-the-box monitoring for most vendors of switches, routers, firewalls, load balancers, servers, applications, databases, VoIP systems, and storage from a single web-based console, LogicMonitor renders performance monitoring, historical trending, reporting, and email/SMS alerting to proactively warn IT staff of potential issues before they cause business interruptions. The user can opt free 14-day trial or $249 per month for SaaS-based data centers monitoring of physical, virtual, and cloud-based IT infrastructures.
17. Pingdom Server Monitor (previously Scoutapp – Hosted Server Monitoring)

Pingdom Server Monitor offers 30-day free trial or $10 per server monthly options for its users making it an affordable option. It provides flexible charts and alerts and deploys in five minutes or less, 60+ monitoring plugins, and no ugly configuration syntax to memorize (do it all via our web UI).
18. WhatsUpGold – Network & Server Monitoring Software

With WhatsUpGold, you can figure out how your IT environment is performing with the server and network monitoring. One can opt for a free 30-day trial then be charged $1,595 to use active, passive, and performance monitoring techniques to monitor the performance, availability, and status of your network, servers, and applications.
19. BMC TrueSighe Plus (Formerly Boundary) – Server & Application Monitoring for DevOps

It’s a Server & Application Monitoring for DevOps which is Application-Aware Infrastructure Performance Monitoring. Costing Free 14-day trial, then from $12.25 per month, it requires no change to the application and is agnostic across languages and infrastructures, collects massive amounts of performance data, sits on every VM, amalgamates data from other sources and puts it all in context with its real-time, unique application map.
20. op5 – Open Source Network Monitoring & Server Monitoring
Op5 Monitor sells downloadable software that monitor, visualize and troubleshoot IT environments and collect information both from hardware, software, virtual and/or cloud-based services. Being a software product for a server, Network monitoring and management based on the open source Project Nagios, is further developed and supported by op5 AB and displays the status, health, and performance of the IT network being monitored and has an integrated log server, op5 Logger.
21. PA Server Monitor – Server monitoring and network monitoring.
Available to users at $49 or a free trial, the primary function of the software is to monitor the Data that’s kept on customers servers and not stored in the cloud. Developed by Power Admin LLC, PA Server Monitor is a server monitoring and network monitoring software application. It’s an agentless monitoring software to watch ping, CPU, memory, disk, SNMP traps, events, with available historical reports with apps available for iOS and Android.
22. Sealion – Server monitoring
SeaLion is a cloud-based system monitoring tool for Linux servers that collect data consistently from servers which will be available on Sealion workspace and be availed at 8$ per month or the users can opt for a free trial. On executing a command, it gets started and installs an agent at /usr/local/sealion-agent and runs as an unprivileged user (sealion).
23. Server Density – Server monitoring
Server Density saves time and effort with simple, reliable server monitoring. It provides bulletproof monitoring out of the box with endless ways to customize. FreeBSD, Windows, OS X and Linux server monitoring with custom plugins are available at free trial or $10 per month.
24. Eventsentry – SIEM, Event Log Management & Windows Server Monitoring

The EventSentry Web Reports offer a powerful, yet easy to use the web interface to review changes on your network. EventSentry ensures that you are notified about the issues before they lead to costly downtime by monitoring each Windows server in real time.
25. Zenoss

Server Monitoring Capabilities of Zenoss include Dynamic, centralized network and IP address inventory for discovered devices, Integration and monitoring of SNMP traps with other IT infrastructure event streams. It enables discovery of blade enclosures and their management consoles as well as the enclosed components and mapping of slots to blade servers. It permits monitoring of memory, throughput, disk utilization, power consumption and processor speeds. Along with performance charts, synthetic transactions and availability metrics, it provides file system and process monitoring. Some of the features are given below:
- Network interface and route monitoring
- Central processing unit (CPU) utilization information
- Hardware information, including memory, number of CPUs and model numbers
- Operating system (OS) information
- Software package information, e.g., installed software
Why Server Monitoring Tools Are Important
Using reliable server monitoring tools provides several benefits:
- Detect server issues before they cause downtime
- Monitor system performance in real time
- Improve infrastructure reliability
- Optimize resource usage
- Prevent performance bottlenecks
These tools also help organizations maintain high availability and ensure their applications perform efficiently.
Choosing the Right Server Monitoring Tool
With so many options available, choosing the right monitoring tool depends on several factors:
- Size of your infrastructure
- Type of servers and applications you manage
- Budget and available resources
- Required monitoring features
Some organizations prefer open-source tools for flexibility, while others invest in commercial solutions for advanced automation and enterprise support.
Conclusion
There are many server monitoring tools available for businesses of all sizes. Each tool offers different capabilities for monitoring server performance, applications, and network infrastructure.
Before selecting a tool, evaluate your infrastructure requirements, scalability needs, and available IT resources. This will help you choose a monitoring solution that aligns with your operational goals.
If you need expert help managing and monitoring your servers, SupportPRO’s experienced server administrators can help you implement the right monitoring solution and proactively resolve issues before they impact your infrastructure.
Contact SupportPRO today to ensure your servers remain secure, optimized, and available around the clock.

