
Modern applications run on complex stacks like containers, orchestration layers, cloud instances, microservices,all competing for memory. When memory pressure becomes critical, Linux activates a last-resort mechanism called the Kernal OOM Killer (Out-Of-Memory Killer). In production, this often shows up as a sudden crash with little warning, leaving engineers scrambling to understand what went wrong.
Let’s break down what the Kernal OOM Killer really is, why it triggers, and how to prevent it.
What Is the Kernal OOM Killer?
The Linux kernel manages system memory. When available RAM and swap are exhausted, the kernel has no choice but to free memory. Instead of freezing the system, it kills one or more processes to recover space.
This mechanism is known as the Kernal OOM Killer.
It evaluates running processes and assigns them a “badness score” based on:
- Memory usage
- Process priority
- Runtime
- Whether it’s root-owned
- Whether it’s critical to the system
The process with the highest score is terminated.
From the application side, it looks like an unexpected crash. From the kernel side, it’s survival.
Why Kernal OOM Killer Happens in Production ?
1. Memory Leaks
Applications that keep allocating memory without releasing it eventually exhaust RAM. Common in:
- Java services with poor heap tuning
- Node.js apps holding references
- Python services with growing object pools
Over time, memory usage creeps upward until the kernel intervenes.
2. Container Memory Limits
In Kubernetes and Docker, containers are assigned memory limits. If a container exceeds its limit, the kernel inside the container namespace triggers OOM.
Example causes:
- JVM heap larger than container limit
- No memory requests defined
- Bursty workloads
Many teams forget that the container limit is often smaller than the host RAM.
3. Traffic Spikes
Sudden increases in traffic lead to:
- More connections
- More threads
- Larger caches
- Bigger queues
If scaling is slow or misconfigured, memory can disappear fast.
4. No Swap or Misconfigured Swap
Disabling swap removes a buffer layer. Without swap, the kernel has fewer options and hits OOM faster.
Some production environments disable swap for performance reasons, unintentionally increasing risk.
5. Competing Services on the Same Host
Multiple services sharing a node can starve each other. One noisy neighbor can consume memory and force the kernel to kill unrelated services.
How to Detect an OOM Event ?
Check kernel logs:
dmesg | grep -i oom

journalctl -k | grep -i oom
Typical output includes:
- Process name
- PID
- Memory usage
- Kill reason
Example: dmesg | grep -i oom
Sample Output
[245631.812345] oom-kill:constraint=CONSTRAINT_NONE,nodemask=(null),cpuset=/,mems_allowed=0,global_oom,task_memcg=/user.slice,user:1000

[245631.812389] Out of memory: Killed process 28491 (java) total-vm:8123456kB, anon-rss:6234120kB, file-rss:0kB, shmem-rss:0kB

[245631.812401] oom_reaper: reaped process 28491 (java), now anon-rss:0kB, file-rss:0kB, shmem-rss:0kB- Meaning
- Linux ran out of RAM.
- The Kernal OOM killer chose the process java.
- It was using about 6GB RAM.
- The kernel killed it to save the system.
Example: journalctl -k | grep -i oom
Sample Output:
Jun 12 14:32:10 server1 kernel: oom-kill:constraint=CONSTRAINT_NONE,nodemask=(null),cpuset=/,mems_allowed=0,global_oom

Jun 12 14:32:10 server1 kernel: Out of memory: Killed process 9912 (postgres) total-vm:10482312kB, anon-rss:8342200kB, file-rss:128kB, shmem-rss:0kB

Jun 12 14:32:10 server1 kernel: oom_reaper: reaped process 9912 (postgres), now anon-rss:0kB, file-rss:0kB, shmem-rss:0kB- Meaning
- At Jun 12 14:32:10 memory ran out.
- The process postgres was killed.
- It was consuming ~8GB RAM.
Example: dmesg | grep -i oom
Output
<empty>
- Meaning
No Kernal Out Of Memory events have happened recently.
Preventing OOM in Production
OOM (Out Of Memory) in production is one of the most painful failures because the kernel suddenly kills processes. Preventing it is a mix of capacity planning, limits, monitoring, and tuning.
Monitor Memory Proactively
- free -h
- vmstat 1
- top
- htop
- ps aux –sort=-%mem | head
In production, use monitoring tools:
- Prometheus + Grafana
- Datadog
- New Relic
- CloudWatch
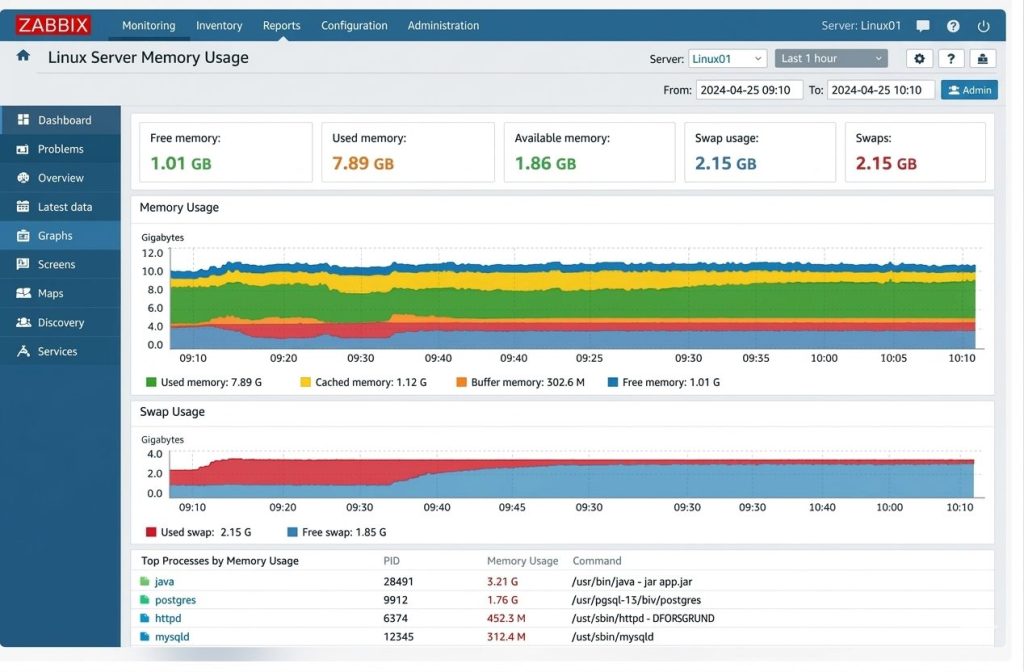
- Zabbix
Alert when:
- RAM > 80%
- Swap > 30%
- Rapid memory growth
Enable Controlled Swap : Use limited swap or memory overcommit strategies instead of disabling completely.
Most OOMs are caused by:
– No limits
– No swap
– Bad heap sizing
– Memory leaks
Fixing just limits + monitoring prevents ~80% of production OOM crashes.
Sample Output of Zabbix Monitoring Tool:
Final Thoughts
The OOM Killer isn’t your enemy, it’s Linux protecting itself.
Most OOM problems come from a few common issues: applications without memory limits, programs with memory leaks, very large heap settings, no swap space, or no monitoring. When one program is allowed to grow forever, it can take memory away from everything else until the system has no choice but to stop it.
OOM should always lead to learning. When it happens, you should check what used too much memory, why it grew, and why nothing stopped it earlier. If you fix the cause, OOM becomes rare instead of recurring.
OOM is not about having more RAM, it’s about using memory wisely, limiting it, watching it, and planning for growth.
With proper limits, monitoring, and tuning, OOM becomes predictable instead of catastrophic.
Frequently Asked Questions (FAQs)
1. How can I check if an OOM event happened on my server?
You can check kernel logs using commands like:
dmesg | grep -i oom
journalctl -k | grep -i oom
These logs usually show the process name, PID, memory usage, and the reason the kernel terminated it.
2. Does adding more RAM solve OOM problems?
Not always. While additional RAM can delay OOM events, many OOM issues are caused by memory leaks, misconfigured limits, or poor resource management. Proper monitoring and tuning are usually required to prevent recurring crashes.
3. How can OOM events be prevented in production?
You can reduce the risk of OOM events by:
- Monitoring memory usage continuously
- Setting proper memory limits for applications and containers
- Using swap space carefully
- Fixing memory leaks in applications
- Implementing alerting for abnormal memory growth
4. Is the OOM Killer a problem or a safety feature?
The OOM Killer is actually a safety mechanism. Instead of allowing the system to completely freeze due to memory exhaustion, it terminates specific processes so the rest of the system can continue running.
5. Can containers trigger OOM events?
Yes. In containerized environments like Docker or Kubernetes, each container has a memory limit. If the application inside the container exceeds this limit, the kernel may trigger an OOM kill within that container.
Want to avoid unexpected OOM crashes in production?
Start monitoring memory usage, set proper limits, and review your system logs regularly. A proactive approach to memory management can save hours of debugging and prevent costly downtime.
Facing issues?
Our technical support
engineers can solve it.

