
Stackify is a developer-friendly solution that helps developers to manage and troubleshoot application or coding issues with integrated monitoring and error logs. Along with the solutions to monitor and manage their applications’ performance, it also provides a cloud-based solution that provides insights about the application’s performance.
In the industry, most of the application monitoring solutions are designed for IT infrastructure. But Stackify is purely designed for developers and it became trending as it combines application logging and code profiling together. It helps software developers in troubleshooting and provides support with a suite of implements including Prefix and Retrace.
PREFIX
A prefix is a free profiler for the .Net and Java applications built by Stackify. It runs on the developer’s workstation and gives them details about what the code is doing while creating or testing their apps.
Below is an example image for a Prefix interface.

It is difficult for developers to imagine troubleshooting applications problems without debug logging. If it all fails and needs more tracking on the code we may add more logging. But the main problem with the log files is the mess and shuffled style. Here, prefix provides a solution be organizing the logging by web request while at the same time showing the SQL queries, HTTP calls, errors, and a whole lot of other things in one established log viewer. Also, in advance, a prefix can track the amount of time taken by the code to respond to the queries as the developers may never have thought about how long it takes.
Following are the key features,
- Finds slow SQL queries, web service calls which may affect the performance
- Able to analyze logging, Debug, & Trace statements
- The application runs only on a developer’s workstation and it is easy to install
- Supports 30+ common .NET libraries
- Runs in the background and is able to revoke when it is required.
RETRACE
Retrace is the Application Performance Management (APM) product for .NET and Java applications. Retrace combines code level performance profiling, centralized application logging, error tracking, application metrics, server monitoring, and more. It avails developers to understand the performance for all their applications across all their servers. The application is cheaper than the expensive products in the industry like New Relic, AppDynamics, etc.
Usually, the APM products collect a large amount of data which is very useful for developers. However, the main drawback is that the products were never really designed for that purpose only. But it is mainly for IT operations and sold as expensive application monitoring products. Here, the developers need access to the same type of data from different angles.
Retrace place a solution to this, by providing visibility to understand why the applications developed aren’t working correctly. There can be many reasons like application errors, high CPU, a server down, slow SQL query, or many other things.
Retrace is a simple to use SaaS application monitoring solution that combines several key aspects like the following.
APM – Performance visibility in code level
Transaction tracing – Analyse what the code is doing
Metrics – Monitoring of server, application and other custom rules
Logs – Collection, searching, and management
Errors – Collection, reporting & alerting
Alerts – Regular monitoring and Notification
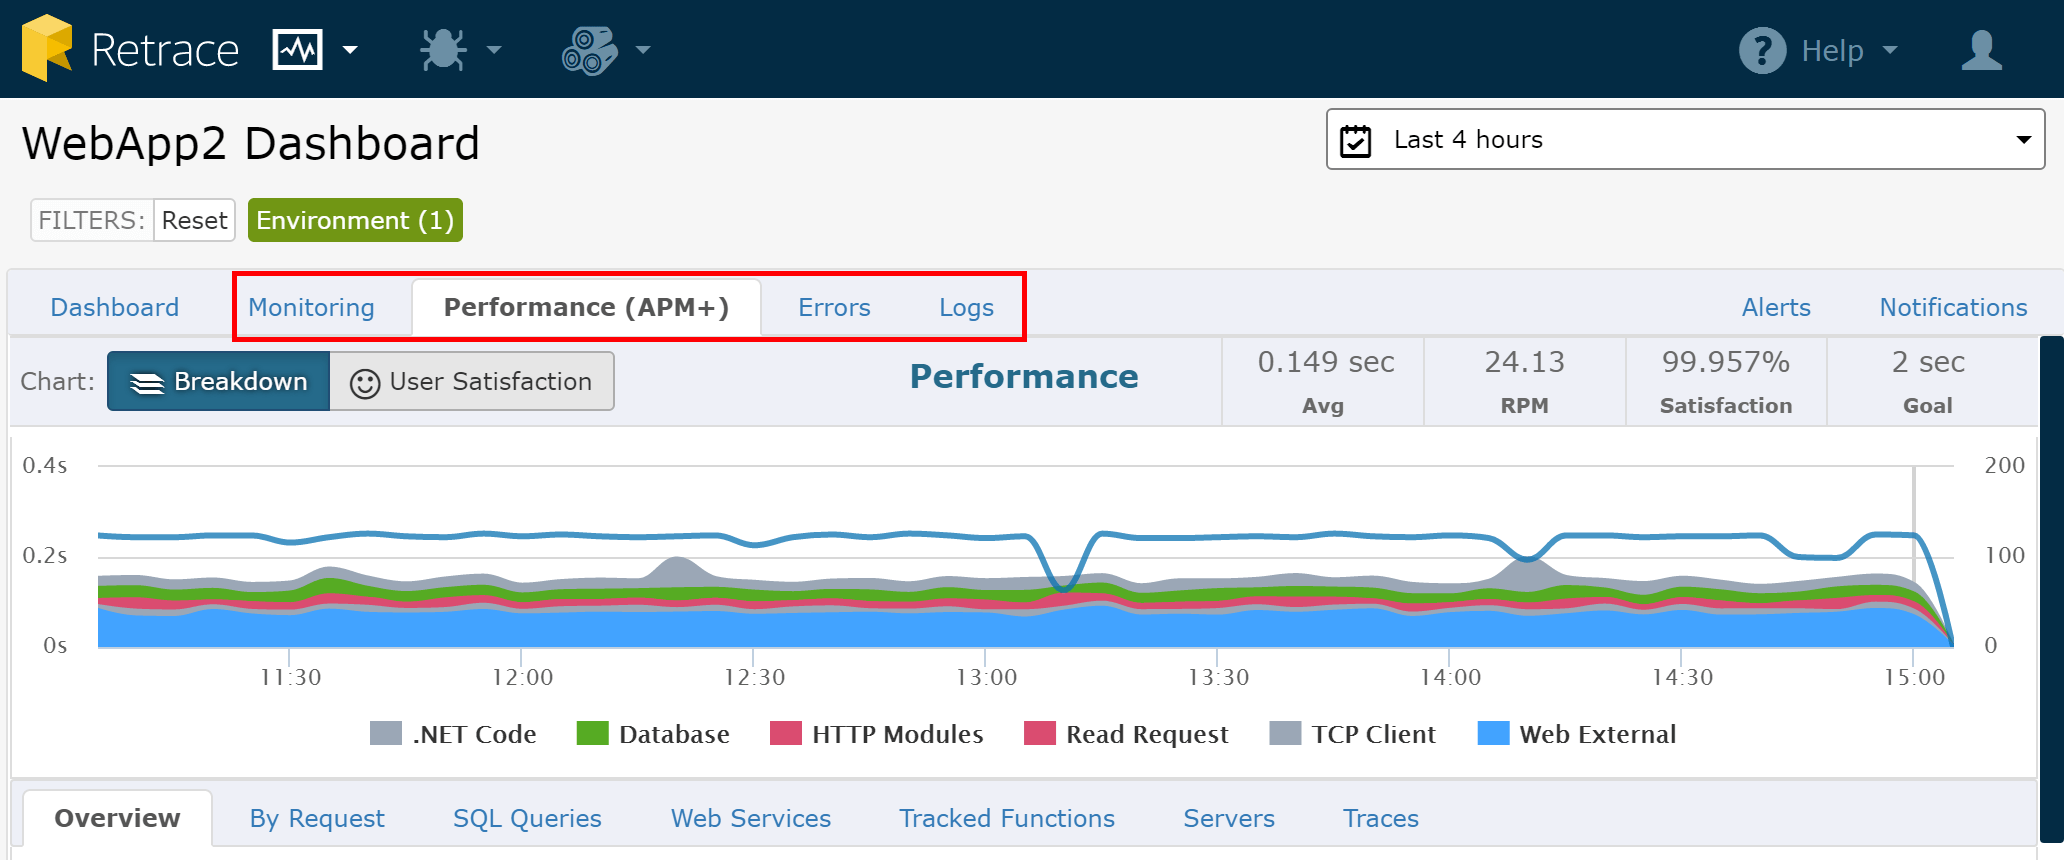
Below is an example image for a Retrace interface.
In short, Prefix and Retrace both function as profilers to collect performance and behavior details about the code. The main difference is that Prefix is designed to run on the developers’ workstation and Retrace, on the other hand, is designed for servers and collects all the performance details together.
FAQ Section
- What is Stackify?
Stackify is a developer-focused monitoring solution that helps track application performance, logs, and errors to simplify troubleshooting.
- What is Stackify Prefix used for?
Prefix is a free profiler that runs on a developer’s machine to monitor code behavior, SQL queries, and performance during development.
- What is Stackify Retrace?
Retrace is an application performance monitoring (APM) tool that combines logging, error tracking, metrics, and server monitoring in one platform.
- What is the difference between Prefix and Retrace?
Prefix is used locally during development, while Retrace is used in production environments to monitor application performance across servers.
- Why should developers use Stackify tools?
They provide deep visibility into code performance, help identify errors quickly, and improve application efficiency.
If you require help, contact SupportPRO Server Admin
Facing issues?
Our technical support
engineers can solve it.

