

Common Reason,
1. Resource exhaustion (disk usage, memory, and CPU usage)
2. Firewall misconfiguration
3. IAM permission issue
4. VPC network and routing issues
5. DNS configuration issue
6. Load Balancer issue
A. Resource exhaustion:
I don’t have any live project created yet to give you, but I will provide some steps on how to check the issue.
How to replicate the issue
- Log in to the Google Cloud console link
- Click on Kubernetes Engine >> Workloads
3. Select the affected workload.
Please check:
- CPU utilization
- Events and logs
You can also go to Monitoring >> Metrics Explorer to view resource usage over time.
A. CPU utilization:
If CPU consumption is more than 100%, we need to do the steps below.
1. Kindly increase the CPU allocation.
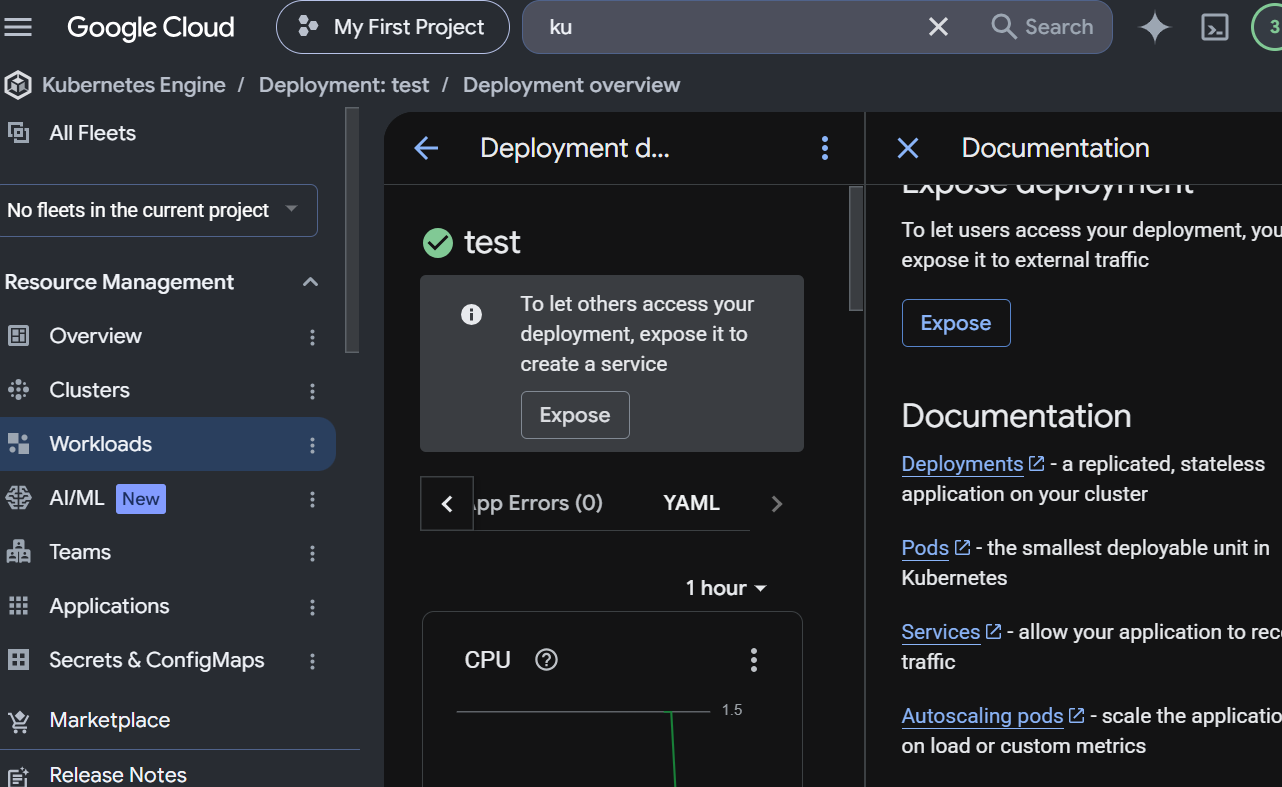
Kindly search Kubernetes Engine >> Workloads.
Select the deployment.
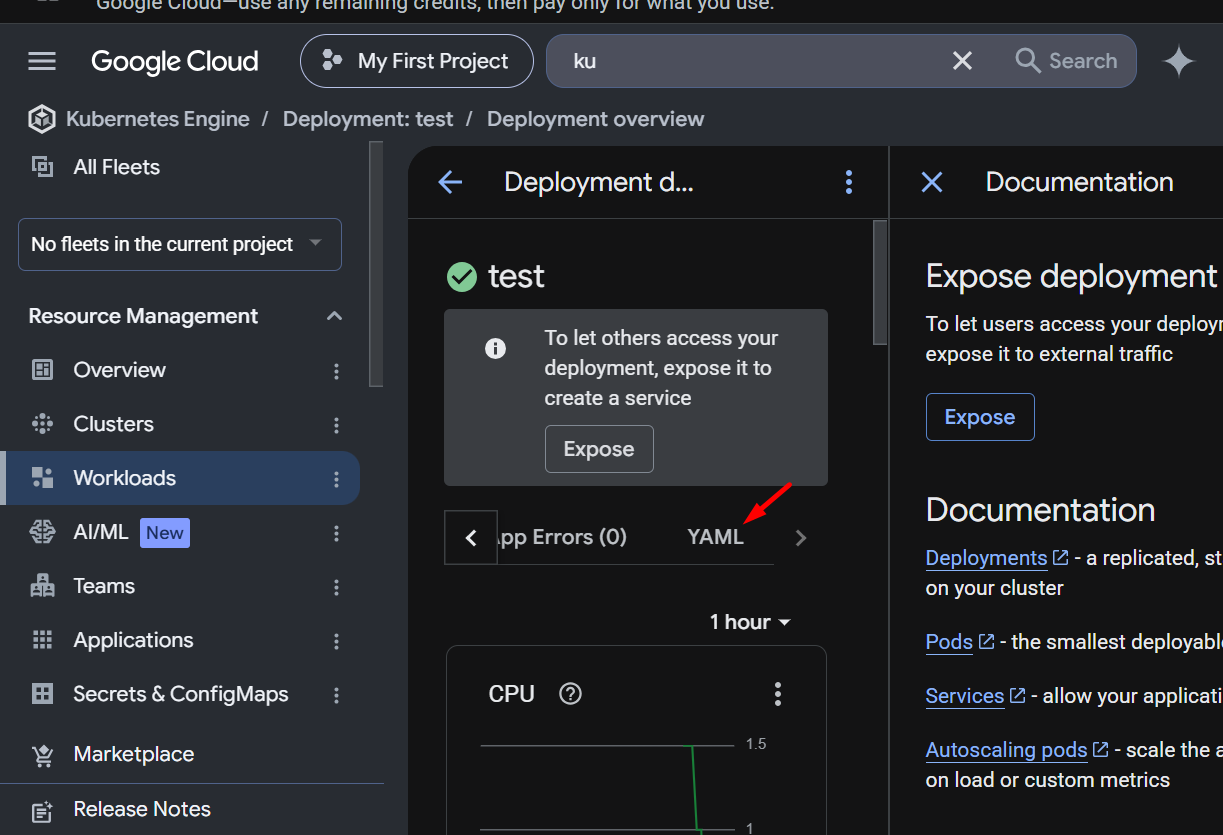
Please log in to the Action >> Edit YAML.
In the code, we need to increase the CPU value as needed and save the changes.
Check Kubernetes Node Disk Usage in Google Cloud Console
- Kindly open Google Cloud Console
- Kindly search Kubernetes Engine >> Workload
- Select your Kubernetes cluster.
- Go to Observability >> Metrics.
- Check the metrics as below
Node filesystem usage
Node filesystem capacity
Disk pressure
What needs to be checked,
Kindly check the disk usage (80-90%).
Also check if disk usage is close to 100%.
2. Misconfigured firewall rules:
If the firewall configuration is not configured correctly. It allows unwanted traffic, and it may cause the issue to increase resources and bandwidth.
To check the firewall rules, kindly refer to the steps below.
Open Google Cloud Console.
Go to VPC Network >> Firewall.
Check all existing firewall rules.
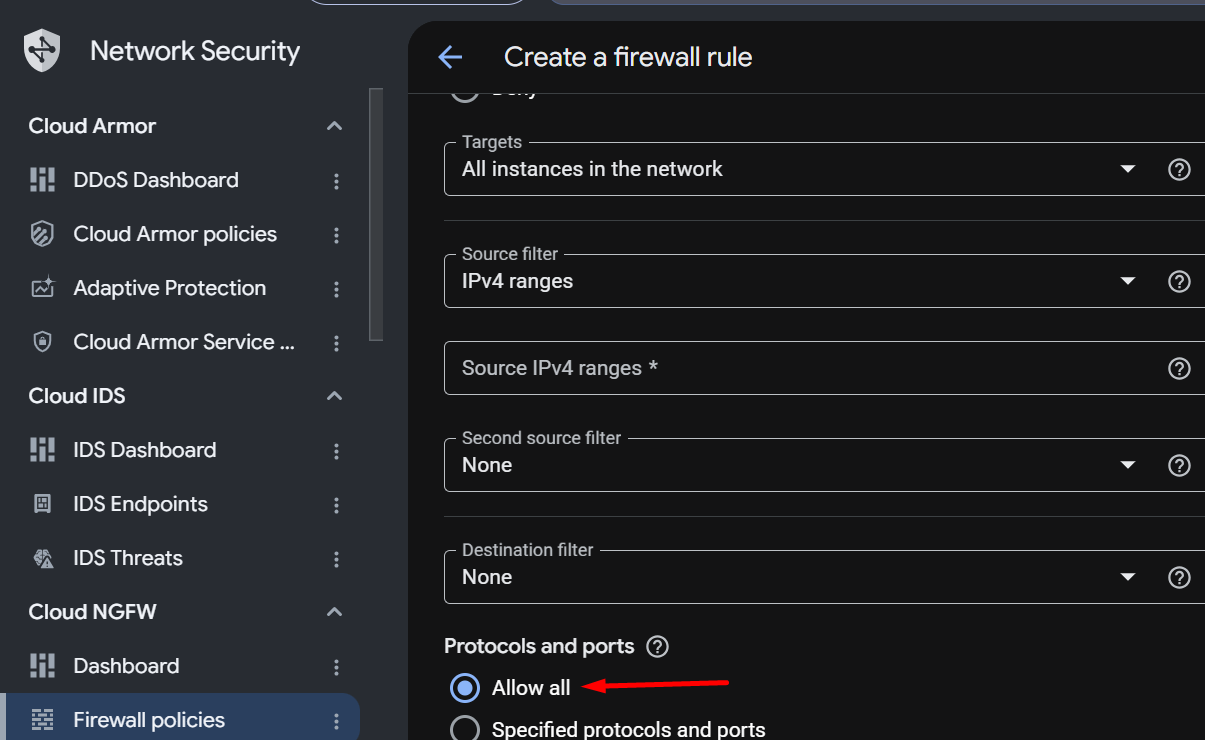
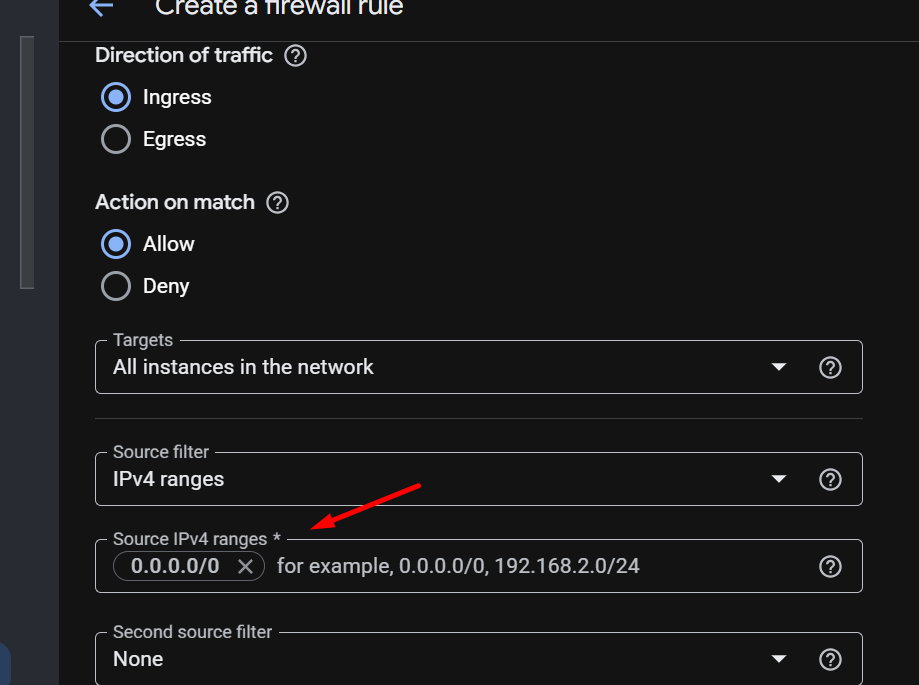
If the firewall rules are not configured correctly and unwanted traffic is allowed, it’s important to tell the customer about the importance of a secure firewall setup.
Recommend changing the firewall settings or URL configurations to block unwanted traffic.
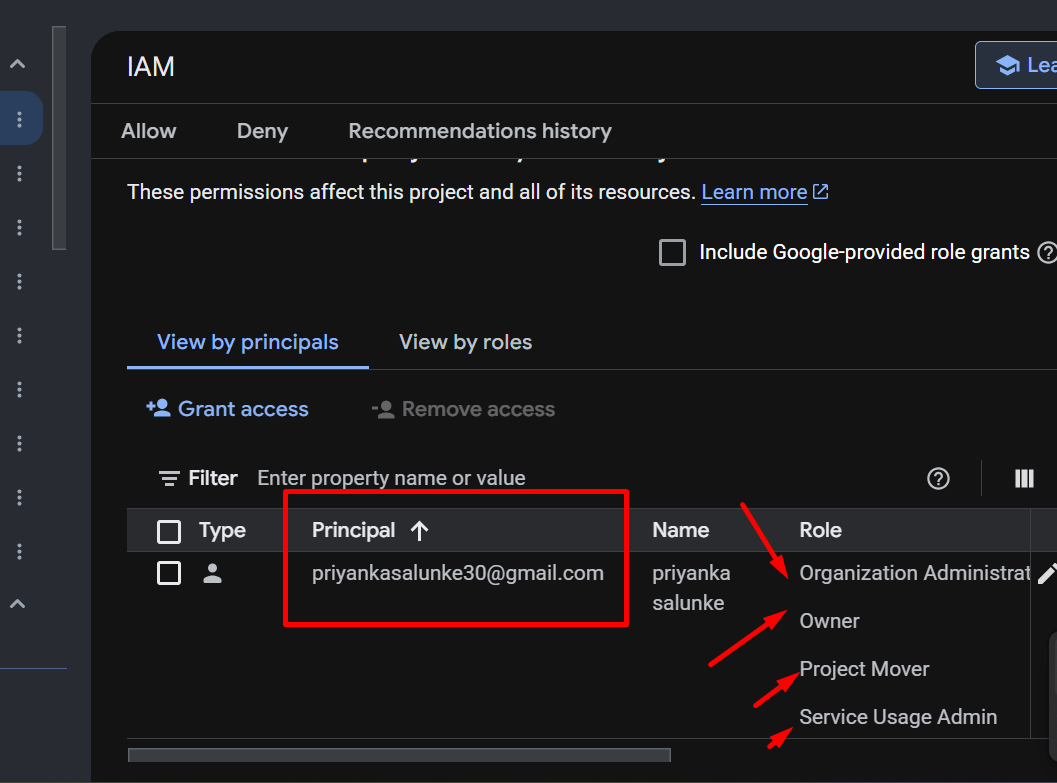
3. IAM permission issues
If the wrong people have access, the client may face service outages or run out of resources.
So users need to check who can access the project.
If you notice resources disappearing because of IAM issues, adjust the permissions.
Simply don’t provide access to everyone. Only permit Storage Viewer or Storage Admin. Don’t permit it to all; it may cause an issue.
.
Where to Check IAM Permissions:
Open the Google Cloud Console.
Select your project.
Go to IAM & Admin >> Check IAM permissions.
Here you can see:
Users and service accounts
Assigned roles
Permissions they have
4. VPC networking and routing problems
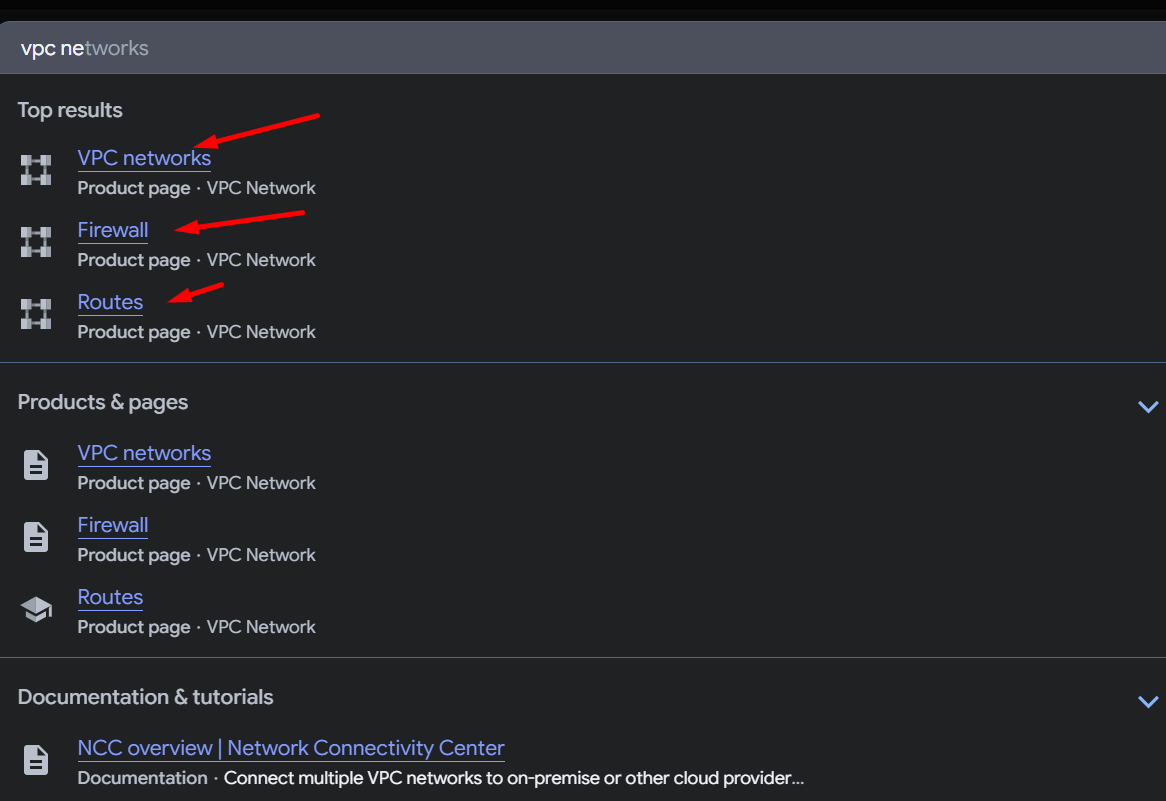
The main issue with the VPC network is because of the incorrectly configured network IP configuration and firewall rules
How to Check:
Check firewall rules.
Go to VPC Network >> Firewall settings and confirm that all required ports and IPs are enabled.
Check Routes:
Verify that the correct routes are set up for internal or internet communication by going to VPC Network >> Routes.
Check IP and Subnet Configurations:
Make sure the virtual machine is connected to the right VPC and subnet.
5. DNS configuration failures
If the application can’t find the correct DNS setting, it may still search the connection, which causes more usage of resources.
When DNS resolution fails, the application keeps trying to find the service, resulting in many DNS queries. This uses up CPU and network bandwidth and can slow performance.
Below are the causes.
1. Incorrect DNS record
2. Missing DNS entry
3. Incorrect Hostname
How can we resolve it by referring to the steps below?
Verify Cloud DNS records and correct wrong entries.
Please check if the private DNS is correctly connected to the correct VPC
Check DNS forwarding configuration.
Monitor DNS query volume and error rates.
Configure applications with proper retry limits and DNS caching.
6. Database Availability Issues: –
The connection limit is the highest number of users or apps that can connect to a Cloud SQL database at the same time. If too many people try to connect, it can hit the limit, which might cause errors or make the apps stop working. A Cloud SQL instance reaches a storage full event when there is no more space left for data, logs, and temporary files.
How to Fix:
Check the database connection monitoring.
If the application is using too many connections, kindly restart it after closing any unwanted connections. Set up a connection in the application. Also increase the connection limit if needed.
To fix the connection problem:
Go to Cloud SQL >> Select your database instance in the GCP Console.
Cloud SQL Instance >> Monitoring
Follow the steps to check database connectivity.
Look for and close any long-running or excessive connections to reduce the load and improve performance.
To fix the storage full issue:
Follow the steps below.
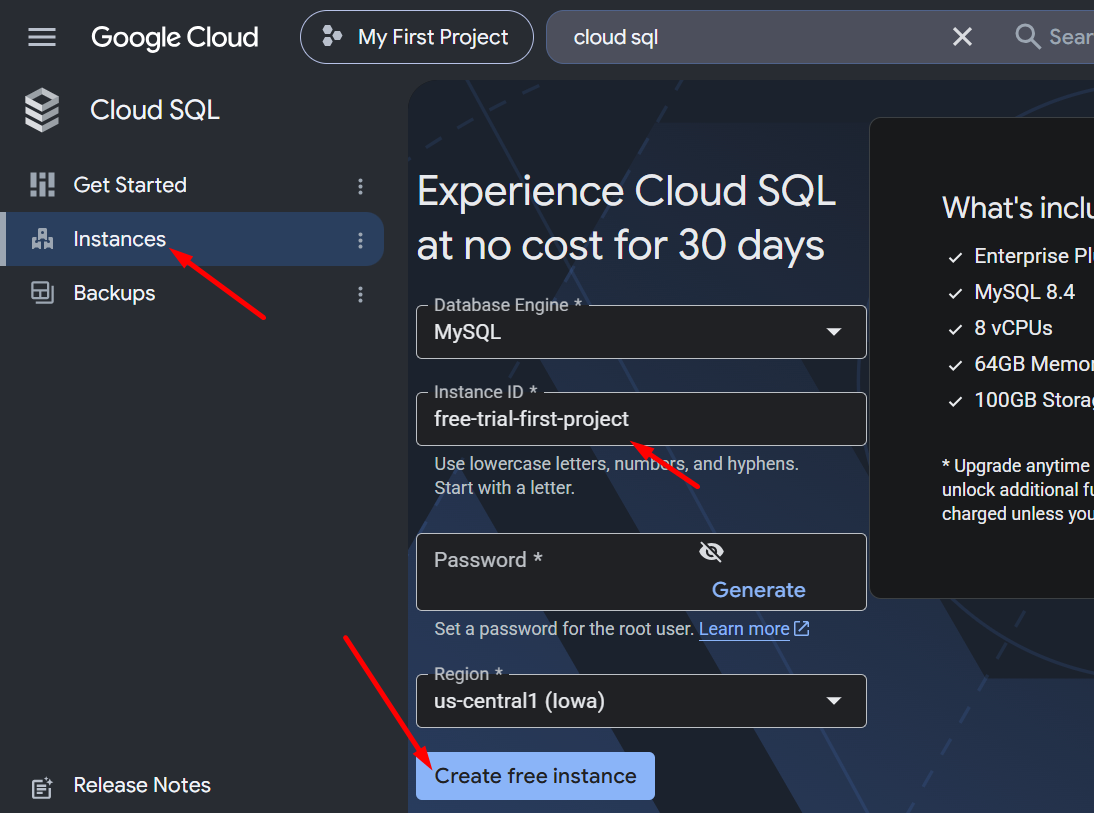
To resolve it, kindly refer to the steps below.
Kindly check the monitoring tool. If the application is creating too many connections, the client needs to restart it after closing any unwanted database connections. Also, kindly increase the database connection pool if needed.
To fix the issue, refer to the steps below
Go to Cloud SQL >> Select Database Instance after logging into the GCP Console.
Go to Cloud SQL Instance >> Monitoring.
Please find the connection of who are running many times and taking more time to run; it may cause resource utilization issues.
7. Load Balancer issue:
The main use of the load balancer is to provide incoming traffic to all backend servers.
If the load balancer is not configured correctly at the user’s end, it may cause a slowness issue and service outage.
To fix this issue, refer to the steps below.
1. Log in to the Google Cloud Console.
2. Then next, go to Network Services>> Load Balancing.
3. Choose the load balancer
4. Kindly check whether all forwarding rules for the front-end and backup-end service are configured correctly or not.
Check backend and firewall rules using the steps below.
- Open the load balancer
- Then select the Backend tab
- After that, check all backend instance statuses (healthy and unhealthy)
- Also check the firewall rules
Go to VPC network >> Firewall.
Facing issues?
Our technical support
engineers can solve it.


