


To check out what is going on with the Google Cloud Platform application when it is not working fine, we need to collect information from the Google Cloud Platform application, the system that supports it, and the network. This information helps us find out where things are slowing down or getting stuck. If we take an approach to looking at the Google Cloud Platform application, we can find the main problem with the Google Cloud Platform application pretty quickly.
1. Major points:
Response Time
Error Rate
Usage of resources
2. To resolve the issue, we need to check the points.
1. CPU usage
2. Disk input/output
3. Network traffic.
4. Use of memory
3. Check cloud logging.
1. Requests are slow.
2. Exception
3. Errors in the database
4. Requests are sent slowly.
4. Kindly use Cloud Trace to check slow performance.
1. Slow HTTP endpoints
2. External API calls
3. Database Queries
5. Database Performance
Database slowness
Index miss-issue
Query taking time to run
1. Log in to the Google console.
2. Choose the project on which the application is running.
3. Check the project health using the steps below.
Log in to the menu >> Operations >> Monitoring.
Monitoring determines if there is any CPU utilization or disk I/O usage after a successful login.
Connecting to the database
Please check the monitoring tool for CPU usage warnings ranging from 80% to 90%.
Nearly 100% memory
Next, check the logs.
Refer to the steps below.
Operations>> Logging >> Logs Explore
In that option, kindly see the warning below
Timeout error
Database connection issue
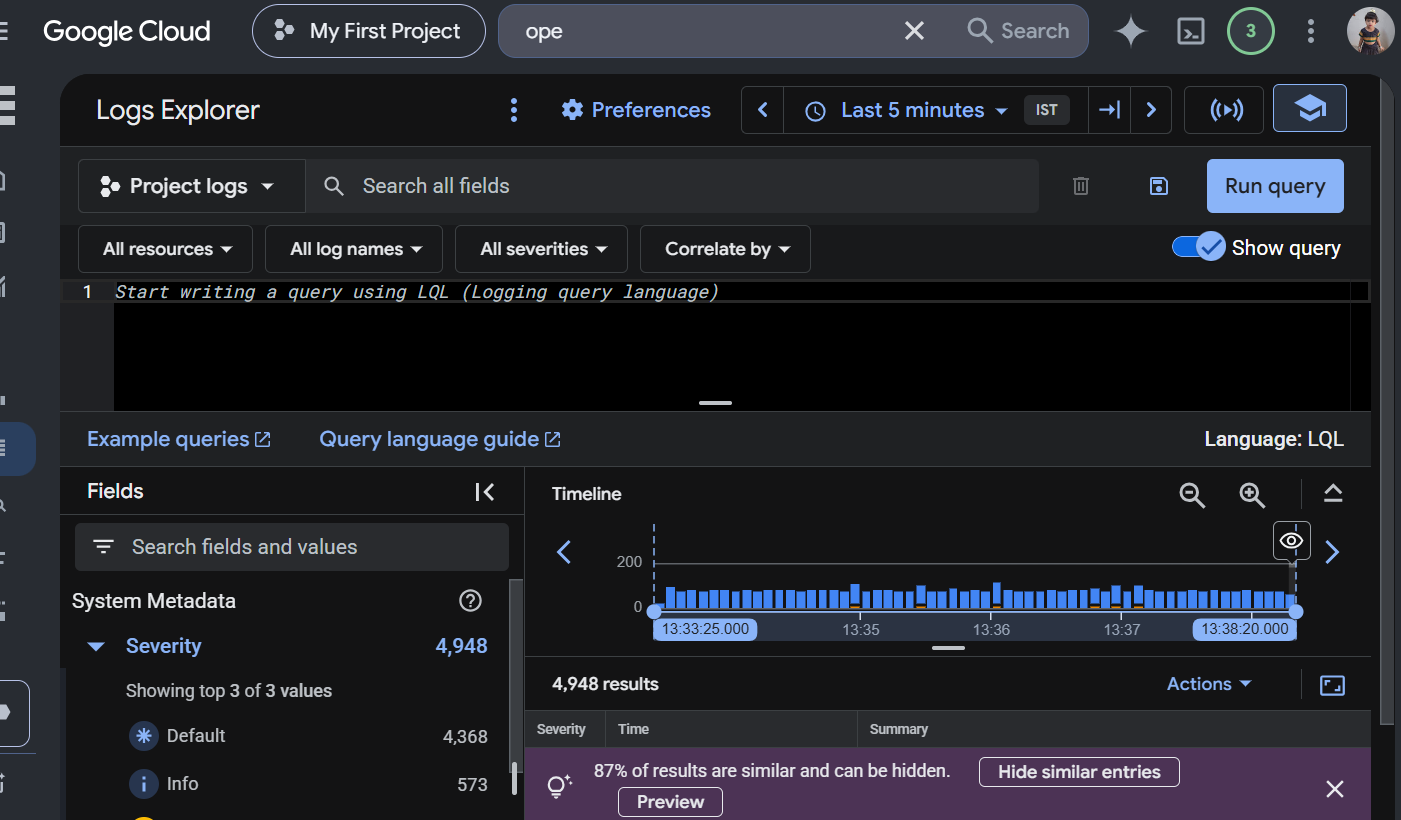
Out of memory warning
To check the CPU and memory usage, refer to the following steps
Log in to the Google Cloud panel.
Refer to the steps below.
Cloud Run >> Your service >> Metrics
To check memory usage
Refer to the steps below.
Kubernetes Engine >> Workloads
Check the pod status and CPU usage. If pods are continuously restarting it it is showing OOM killed.
Kindly check Cloud Monitoring to identify if the CPU and memory usage seem high; then check the logs to explore for application issues, and also use Cloud Trace to locate the slowness issue.
First, I check Cloud Monitoring to identify whether CPU, memory, latency, or error rates have increased. Then I review Logs Explorer for application errors and use Cloud Trace to locate if we identify the slow query and need to optimize it. The issue is related to resources, and I need to increase the CPU and memory
============================
To resolve this, refer to the steps below.
Check cloud SQL:
Click on SQL.
Select the database instance.
Kindly open Query Insights.
Check all queries, like slow queries and stuck queries.
Optimize the Database
Optimize the database.
After optimizing the queries, but the CPU usage is still high, please refer to the step below.
- Cloud Run
- Click on Cloud Run.
- Select the service.
- Click on Edit and deploy a new revision.
- Kindly increase CPU (for example, from 1 vCPU to 2 vCPUs).
- Save it
GKE:-
- Go to Kubernetes Engine >> Workload
- Select the workload.
- Increase CPU requests and limits in the deployment.
- Save the changes.
Compute engine
- Click on Compute Engine>> VM instance
- First, stop the VM
- Change the machine type to high-resource, like CPU and memory
- Start the VM
- Configure autoscaling
- If traffic is still high, refer to the step below and configure autoscaling
Cloud run
- Kindly open Cloud Run.
- Kindly select the service
- Click on edit & new deploy revision.
- Increase the maximum number of instances.
- Save the changes
GKE
- Click on Kubernetes Engine >> Cluster
- Kindly select the node pool
- Enable and adjust the autoscaler
To avoid this in the future, or catch the issue early to avoid any interruption
Click on Operations >> Monitoring >> Alerting.
Kindly check CPU and memory alerts
==================================
In addition to problems related to computer and application code, storage and networking configurations can also cause performance problems In this case, we need to check all things of the application and need to investigate what the exact issue is
Storage can be a problem when applications need to read or write a lot of data.
This can slow down the application.
If the application is running on Compute Engine, it may be slow because the attached disk can’t handle the input and output operations
To check this, we need to:
1. Open Google Cloud Console, then go to Compute Engine. Then go to VM Instances.
2. Select the machine that is having problems.
3. To see the following things
How many times is the disk being read?
To check further, we need to monitor the disk: how many times the disk is read and how much time it takes to read
If the disk takes time to read and write, the disk may be slow because
Too many database operations are happening on the same disk.
The application is working with large files.
To resolve this, we can try:
Upgrading to a disk like an SSD
Putting application files and database files on separate disks.
Making it more efficient to access files.
Using cloud storage for files instead of storing them on the virtual machine’s disk.
Investigating Networking Issues
Sometimes the application infrastructure is fine. The user faces a slowness issue; it may be due to network delay. This can happen when the application is in one place. The database is in another place.
For example, the frontend application is running in one region. The backend database is in another region.
When a user does the request
User >> Application Server >> Database in another region >> Application Server >> User
To resolve the issue please refer to the steps as below
1. Kindly open the Network Intelligence Center, then go to the Performance Dashboard.
2. See below.
How long it takes for data to travel between regions
If any data is being lost
If there are any network connectivity issues
We should also check the load balancer metrics:
1. Search Network Services, then Load Balancing.
2. See below
How long it takes for the backend to respond
If the backend is healthy
How requests are being distributed
To fix networking issues, we can try:
Putting services closer to the users.
Keeping the application and database services in the region.
Setting up load balancing correctly.
Reducing communication between services.
Facing issues?
Our technical support
engineers can solve it.


