


Developers should avoid making too many database connections, create better SQL queries, use indexes when needed, and routinely check CPU, memory, and storage consumption in order to increase performance. Application performance may be impacted by cloud SQL performance problems. Incorrect indexing, limited storage, and slow queries that use a lot of connections and system resources could be the reason for the problems you are having with database performance.
If your database workload increases, you may want to utilize more resources.
If the database workload increases, it may be good to increase the resources.
Increasing the resources and optimizing the database query will help to reduce downtime.
A more recent cloud-based database service called Cloud SQL was created to simplify and improve database administration. It helps businesses decrease operational labor while increasing reliability by providing automatic maintenance, backups, and scalability.
=======================================
Slow SQL Queries:
Slow SQL queries are the biggest problem, as they can slow down performance.
The SQL query execution time to execute, which can cause overall application performance to slow down
1. Some common reasons:
– Scanning large tables
– Fetching unnecessary data
– Sorting large datasets
– Missing indexes
Resolution:
1. Access the Google Console
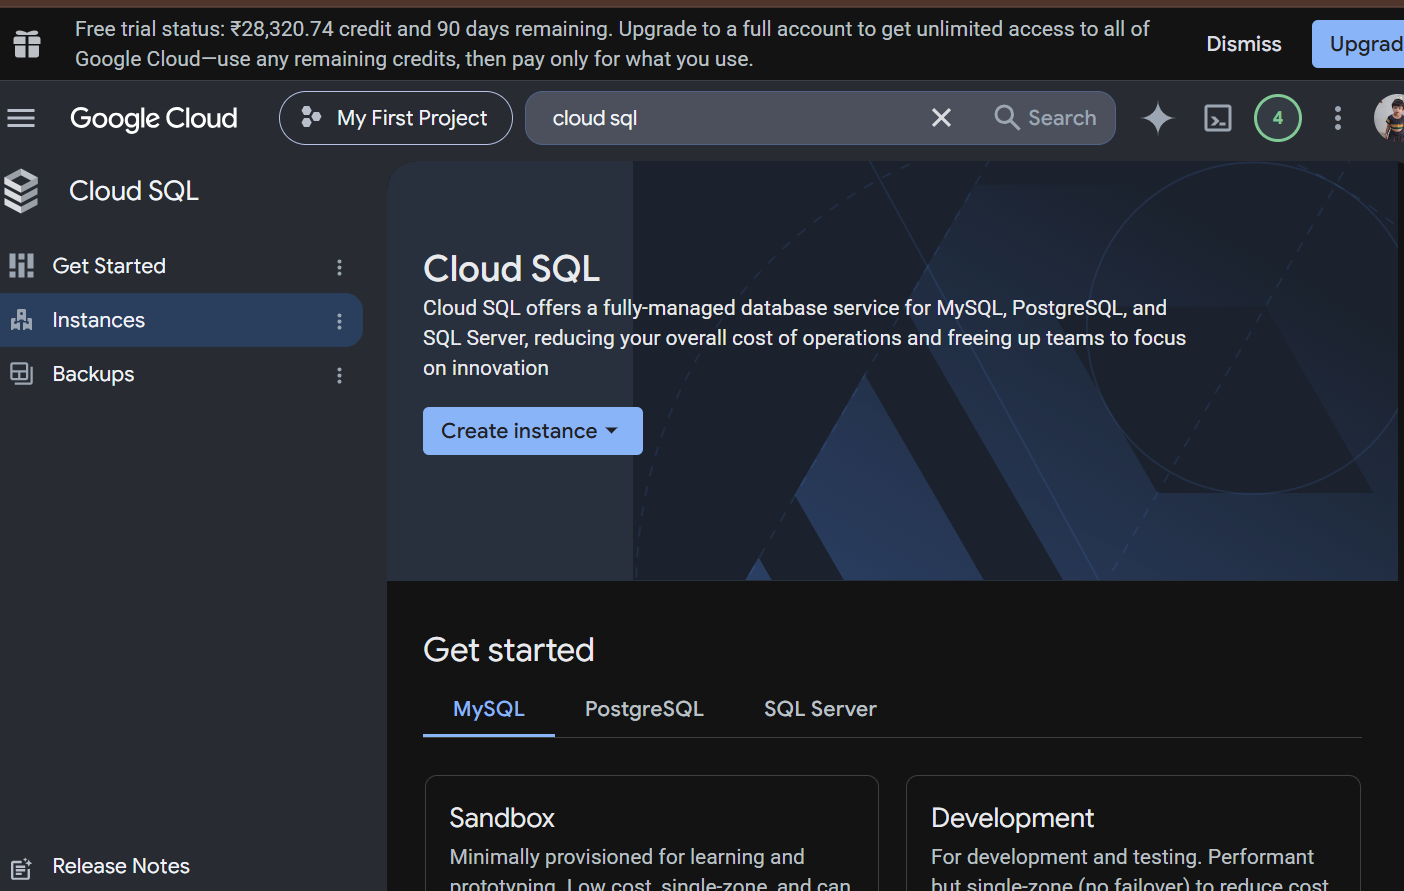
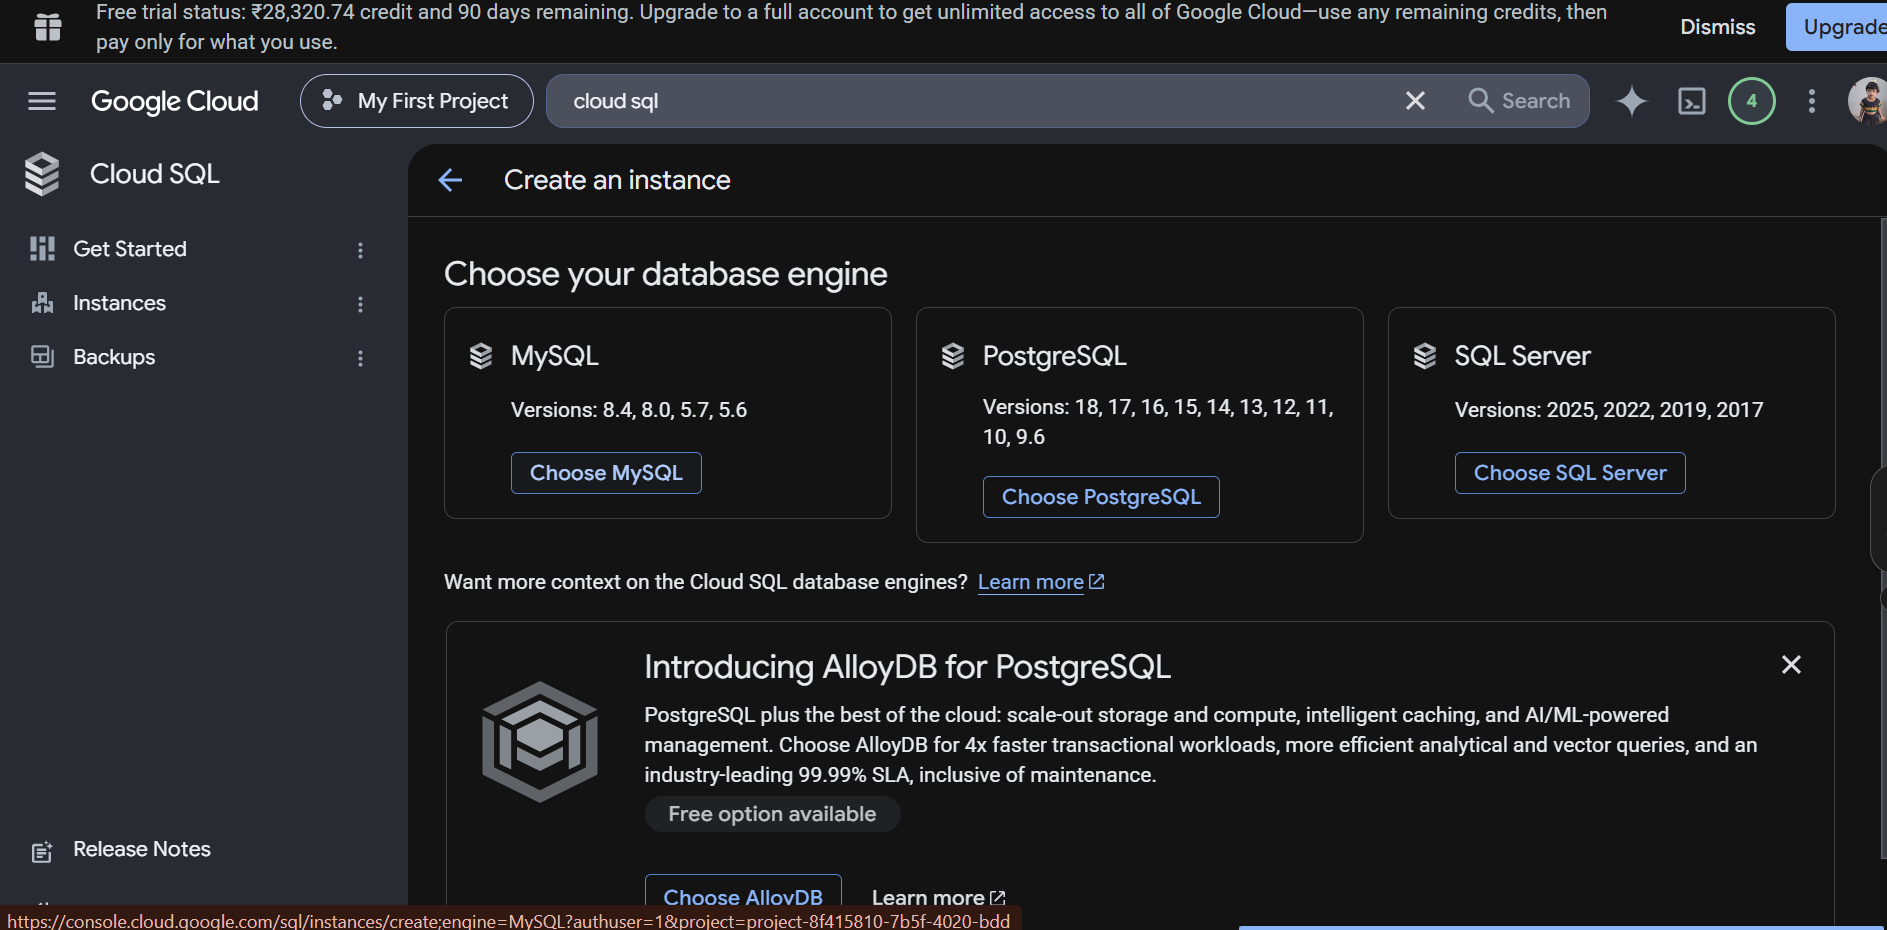
2. Log in to Cloud SQL >> Instance >> Query Insights
3. To check this further, we need to check the query execution time and how many times the query is run.
2. High CPU utilization
The CPU utilization is increased on the application, which means the SQL query may take longer to execute.
Common reasons:
– Large query size
– Too many simultaneous queries
– Missing indexes
Please follow the steps below to check CPU usage
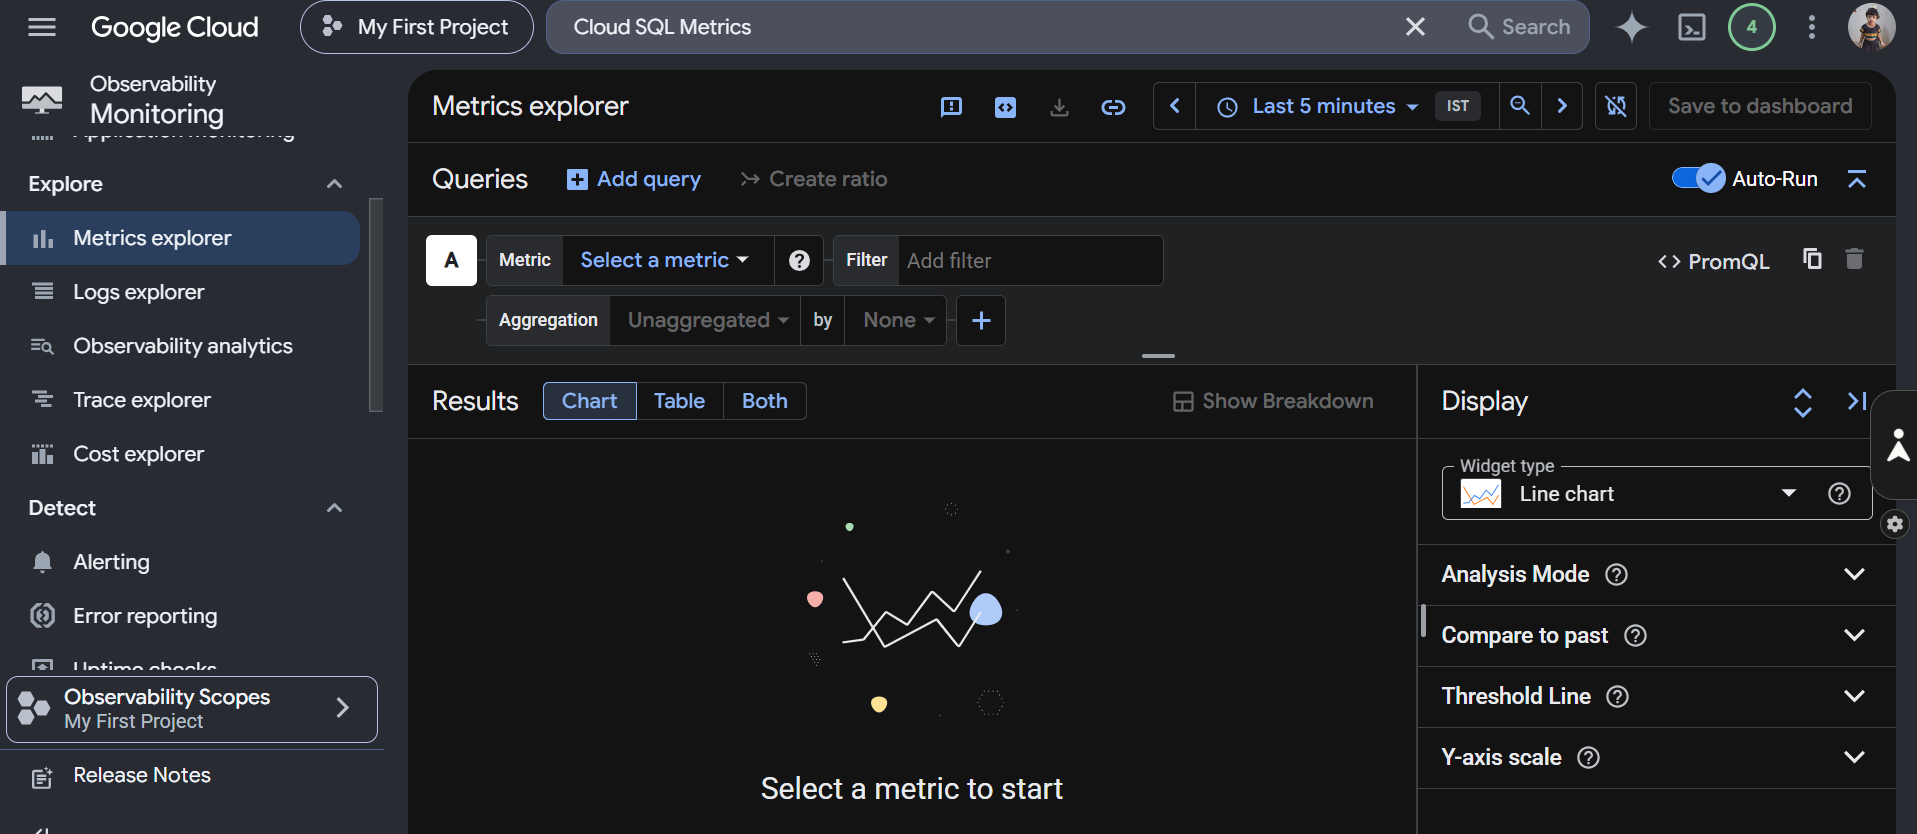
– Log in to >> Metrics Explorer >> Cloud SQL
– In this option, you can see the CPU usage, database load, and query execution time.
In case the CPU usage shows 80 to 90%, we need to check further
Resolution,
Time-taking query
Log in to Cloud SQL Insights >> Query Analysis.
The resolution depends on the query execution time.
3. Solving High Memory Usage
Here is the main role of RAM: it is a frequently used database.
Slow query response
Application delay issue
Reduce disk cache issues.
Common reasons:
Incorrect database connection
Too many simultaneous connections
Log in to Cloud Monitoring >> Cloud SQL Metrics.
4. Connection limit issue:
If the Cloud SQL limit is exceeded, it’s because too many simultaneous connections cause it
Common Reason
Too many idle connections
Incorrect application configuration
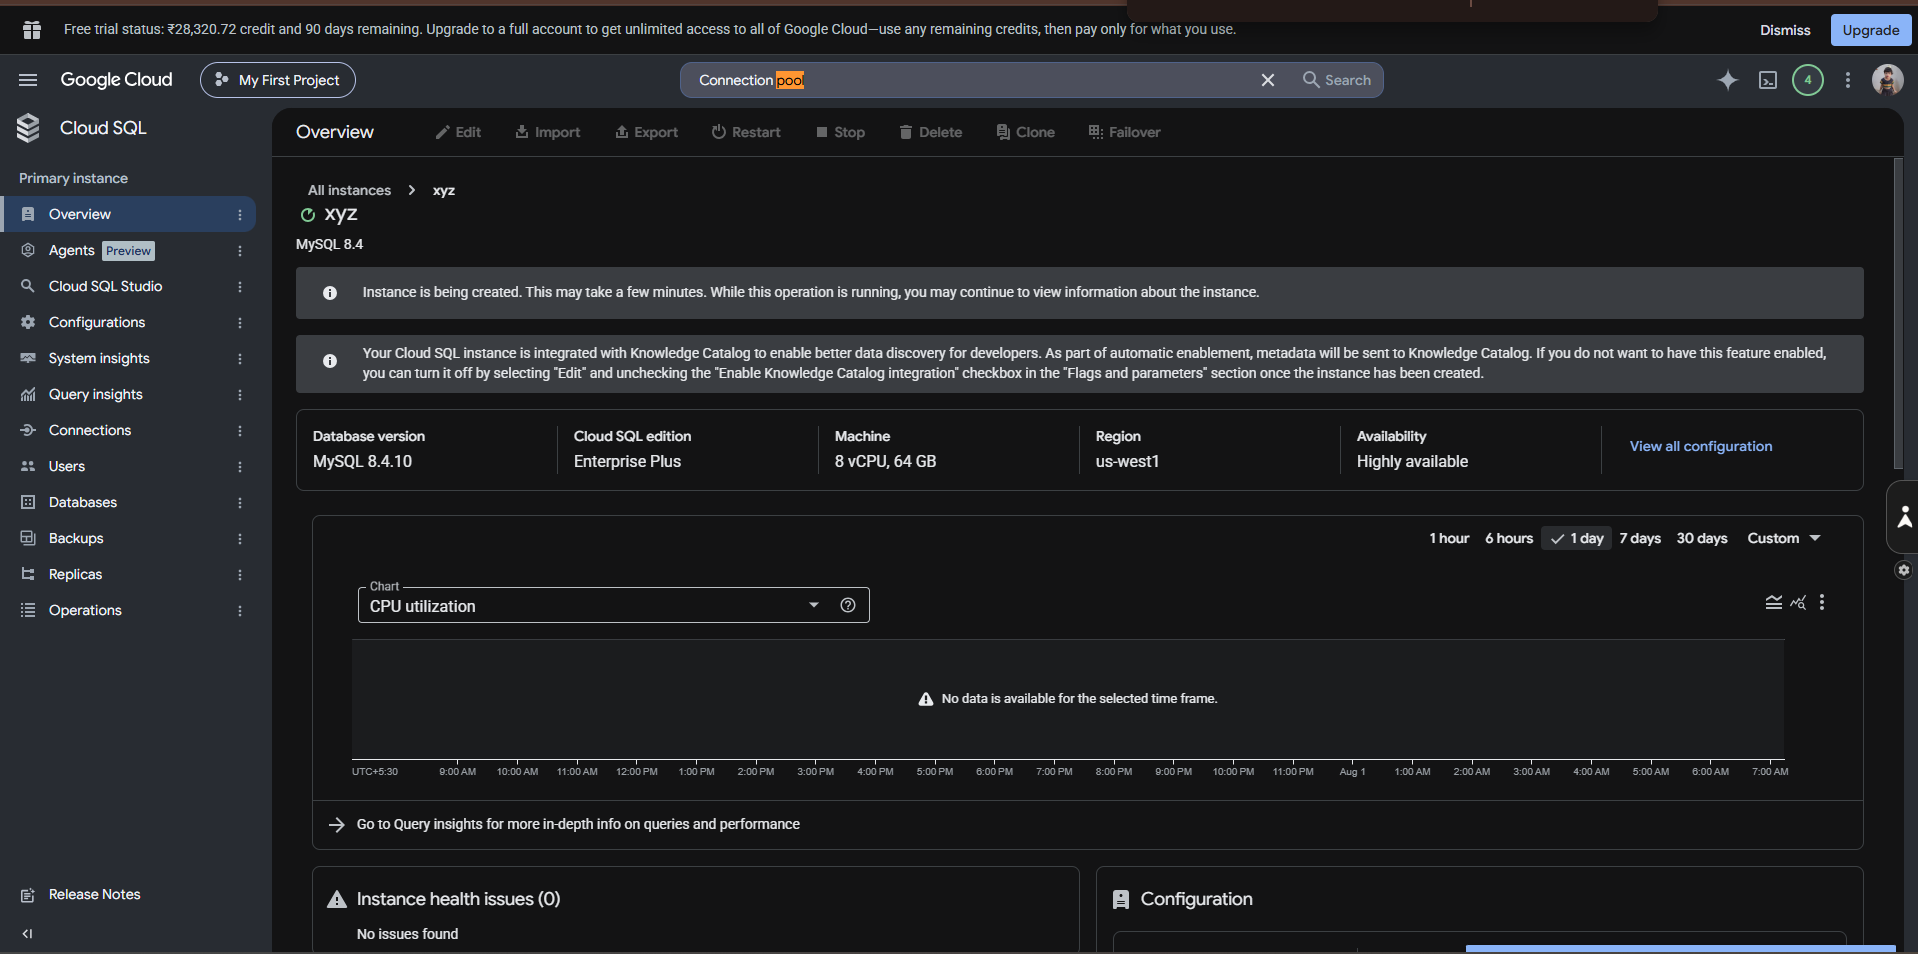
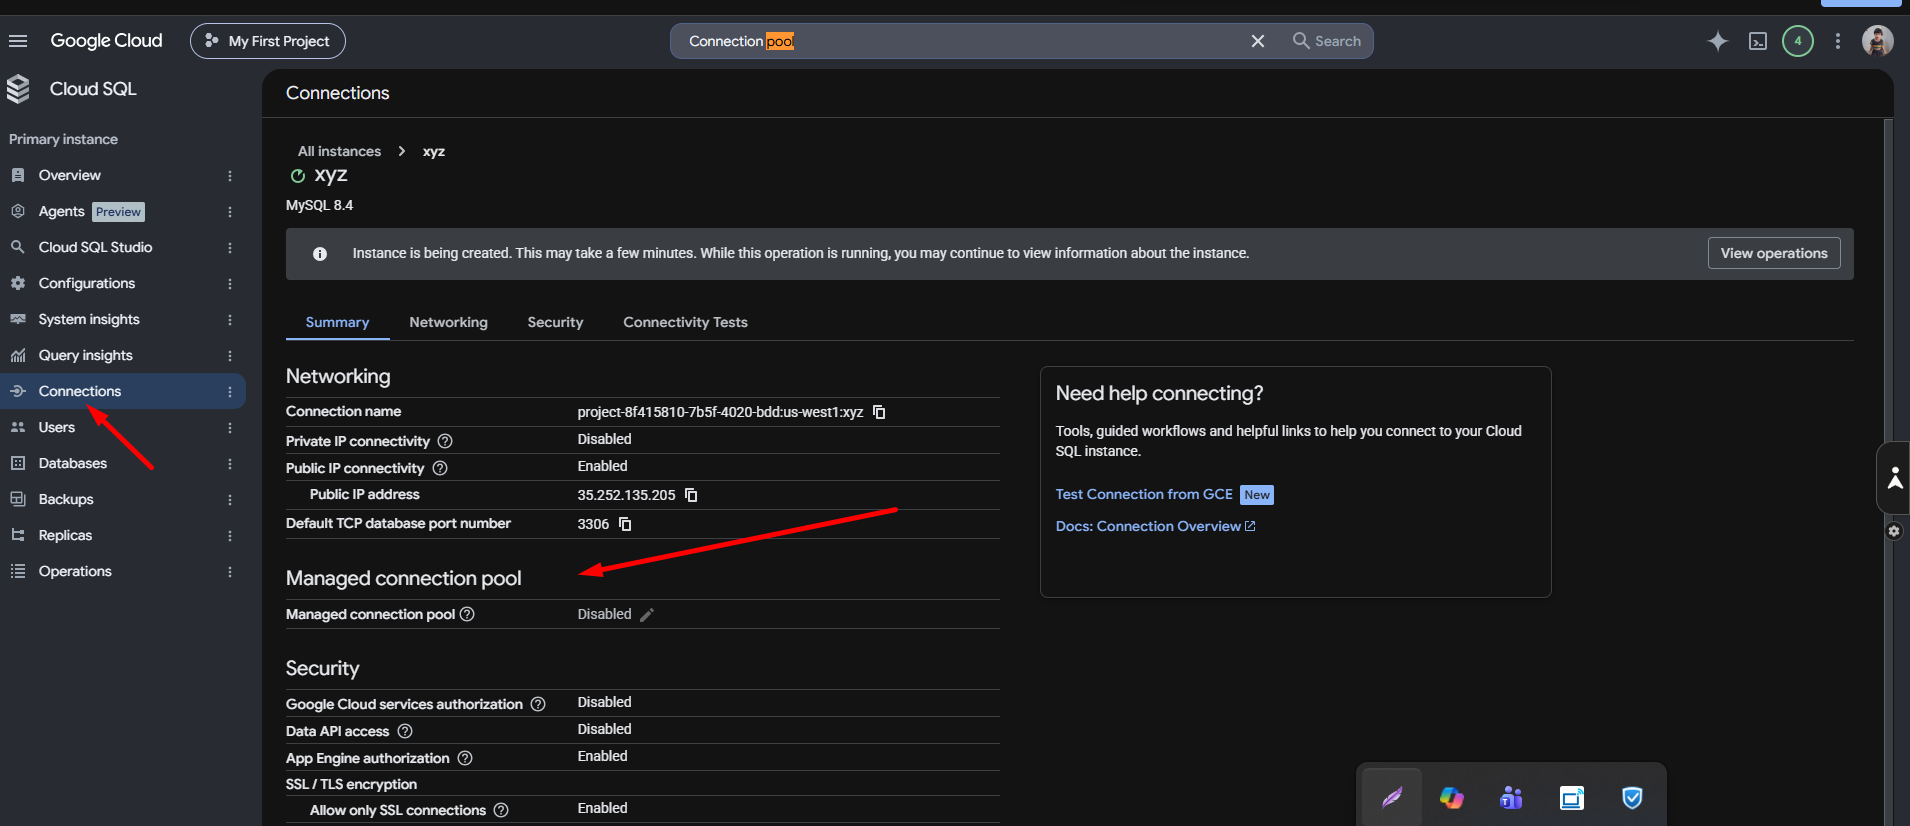
No connection pooling
To set connection pooling
Apply the solution.
Set connection timeout values.
Configure the application connection pool.
Kindly do this to open a new request for the database. Kindly do the steps below
Application >> Connection Pool >> Database
5. Input/output delay problem
Database performance, especially speed, is directly affected by disk performance.
There may be noticeable delays.
Increased application response time
6. Improper Indexing
Indexes can improve query performance, but having two or more indexes can cause issues and impact DB performance.
Create indexes for frequently searched columns.
7. High Disk Latency
Common problems,
High write workload
Large updates
Storage almost full
Investigation:
Review disk latency metrics.
How full is your storage?
Are there really write-heavy queries?
The database performance, specifically speed, is directly affected by disk performance.
There may be noticeable delays.
Increased application response time
These can be caused by:
Missing indexes
Bad SQL
Accessing large datasets
These require:
Checking logs for slow queries
Looking at execution plans
Comparing past execution times
Optimizations can include:
Adding indexes
Adjusting SQL
Restricting the number of output rows
Implementing pagination
In the case of unused indexes,
Delete them.
Regularly checking indexes
You can fix problems like these by using the monitoring tool in GCP.
========================================
Cloud SQL Insights monitors slow queries and looks at patterns in a workload.
Query Insights: Monitor query performance and resource usage.
Cloud monitoring: Keep a check on CPU and memory consumption, storage and disk delay, and the number of connections.
The Cloud SQL logs are used to monitor the database slow query logs and check the database errors.
=======================================
Kindly use the following steps to avoid the same issue in the future
Also monitor the database regularly.
Kindly optimize the databases and indexes regularly.
For better performance, use connection pooling
Set alerts for high usage of CPU, memory, storage, and connections.
Please follow the instructions below to optimize the database.
Return only the columns that are required.
Don’t use SELECT *
Make appropriate use of the WHERE clause.
Reduce subqueries
Use pagination when returning large datasets.
Cloud SQL primarily detects the root causes of performance problems; to ensure performance and scalability, a monitoring tool must be set up, which is done through database maintenance.
Facing issues?
Our technical support
engineers can solve it.


